Trading with the 'Camarilla' Equation
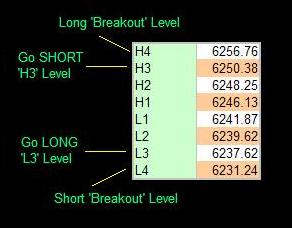
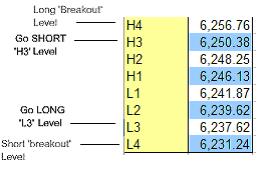
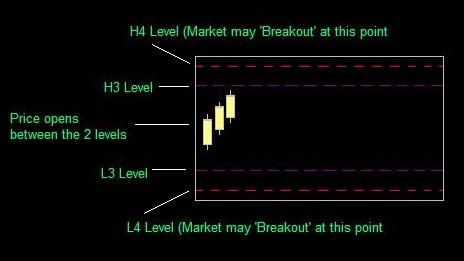
The Camarilla Equation is for experienced traders and involves you in trading both with and against the trend, using simple rules based around price penetration of the L3 and L4 levels at the bottom of the days range, or the H3 and H4 levels at the top of the day's range. It relies on the fact that success in intraday trading requires you to enter and exit trades with the backing of major support or resistance; the positioning of this resistance being determined by the equation. To use the Camarilla Equation, you enter yesterday's open, high, low and close. The calculation then gives you 8 levels of intraday support and resistance. There are 4 of these levels above yesterday's close, and 4 below as shown below.
As you can see, trading with the Camarilla Equation is relatively simple. The important levels to note are the 'L3' and 'H3' levels, where you may expect a reversal to occur, and the 'L4' and 'H4' levels that shows you where a major breakout has been confirmed. How you specifically enter a trade depends to a great extent on the way the market opens.
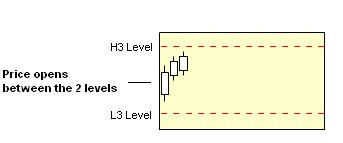
Market Opens INSIDE 'L3'
The following applies both to going 'Long' and going 'short'. If the market opens INSIDE the L3 and H3 levels (i.e. BETWEEN the higher H3 and the Lower L3), you must wait for price to approach either of these two levels. Whichever it hits first (L3 or H3) determines your trade.
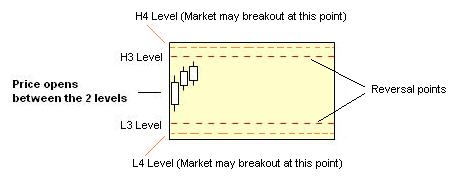
If the HIGHER H3 level is hit, you go SHORT (against the trend) in the expectation that the market is about to reverse. Some traders recommended using the higher 'H4' level as your stoploss point, as a penetration up thru the H4 level actually shows that a major breakout may be under way. I would recommend that you wait for price to bounce back down inside the H3 level again before entering the trade, as you will therefore be technically trading WITH the short-term trend. A fair amount of experience is needed for this style of trading.The opposite, of course applies if the LOWER L3 level is hit first - wait for it to come back up inside the lower L3 level, then go LONG.
Market Opens Outside 'L3'
In this case, you wait for the market to move back up thru the L3 level - you will then be trading WITH the trend, and once again, some traders recommended using the L4 level as your stop loss (although perhaps you should use a sensible stop based on your knowledge of your market.)
Taking profits is a matter of personal judgement - just be aware that you WILL want to take profits at some time during the day, because the market is unlikely to 'behave' and stay right-sided for your trade.
Research suggests that these reversals from L3 and H3 happen as often as 4 times out of 5 during intraday trading.
Using the Equation to trade 'breakouts' is also eminently possible, and essentially involves you going LONG if price penetrates UP thru the higher H4 level, or going SHORT if price penetrates DOWN thru the lower L4 level.
Ok so now you know a little about the equation and how to use it, here is what you have all been waiting for so patiently..... The Equation.
H4 = [1.1*(H-L)/2]+C
H3 = [1.1*(H-L)/4]+C
H2 = [1.1*(H-L)/6]+C
H1 = [1.1*(H-L)/12]+C
L1 = C-[1.1*(H-L)/12]
L2 = C-[1.1*(H-L)/6]
L3 = C-[1.1*(H-L)/4]
L4 = C-[1.1*(H-L)/2]
Where:
H = Days high
L = Days low
C = Days Close
(All values are for the previous day prior to the trade day)
I hope this is of some help, good luck and Happy Trading
Note: I do not accept liability for the accuracy of the equation nor any unexpected results if used for trading.
16 comments:
Thanks for being so generous to provide this formula. Be blessed in all your ventures!!
Hi
Thank you for the equation.
Just clarification, I'm considering trading Forex with the same broker that I'll use to trade stocks. How do you decide what the open is on a 24hour market? For instance, if you traded GBPUSD do you base it on the London open or is there some other considerations.
kaliste
beloved friend
greetings
i think, in the equation u have left out for L1, L2,L3,L4 The formula should have been
like this
L1=[1.1*(H-L)/12]-c
and the same for the rest in the sense 12 will be replaced by 6, 4, and 2. i am not an expert just requesting all who visit this blog to ponder and what a wonderful heart this blogger got to share and care, thanks
cheers
easwaran
india
dear friends
pl for give me, as i did not see the blog clearly, in haste i pointed out some thing wrong which is not, my unending apology for this blog owner
sorry buddy
with love
easwaran
india
Any try and trade with CAMARILLA will get good reward, since it's just amaaaaaaaaaaaaaaaaaaaaaaaaaaaaaaaaaaaaaaaaaaaaaaaaaaazzzzzzzzzzzzzzzzzzzzingggggggggggggggggggggg
I finished 100 day paper work. I took 350 trading calls. 327 target achieved.
Hi all, thanx for the comments. Sorry I've not been able to respond to them sooner. Anyway the Cam' equation works for most markets as far as I am aware. I have had some good success with it and still use it along with other systems.
God bless you. The best things in life are for free. Air,water,rain,and now Camrilla..
Thanks again
DId you know what Time will we use for High, Low, Close in Forex Market, because Forex Market its 24 hours/5days nt like S&P500.
Please let me know.
Thanks
Hi, nice to see someone trying to help others, so here is something free back for traders, go to pivotfarm.com and you will get all support resistance and pivot points calculated for you daily and emailed to you totally free, inc Camarilla.
Have fun and happy trading
Hi,
Thank you so much for sharing. May I ask the obvious question? What are the L1/2 and H1/2 levels are for? No one seems to ever mention how to use them?
Thanks again!
Edster
The L1/L2 & H1/H2 levels are reversal points
I don't use these for any trading signals.
It's the 3/4 levels that are of interest.
I appreciate you publishing the equation. Question, though. You said you had "some success." I have no idea what that means. If it doesn't work more than half the time, it's no better than a coin flip. Is it better than a coin flip? Thanks.
Thanks!
Camarilla works on high volatility days.
Hi and thanks,
Would this formula be the same that Nick Scott created?
There's different one's thru out the internet there's one that claims to be the best for $170 a month which is 'SureFireThing' but there's another one that's free it has for me given accurate levels just punch in the #'s .
http://pivotpointscalculator.blogspot.com/
The formula u gave has the levels tighter with just a one time look at today's levels from yesterday looks pretty good too.
Thanks God bless, He's coming soon.
Post a Comment