Trading with the 'Camarilla' Equation
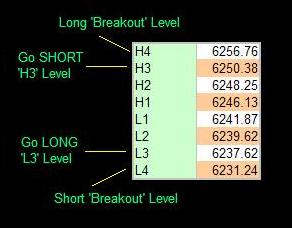
The Camarilla Equation is for experienced traders and involves you in trading both with and against the trend, using simple rules based around price penetration of the L3 and L4 levels at the bottom of the days range, or the H3 and H4 levels at the top of the day's range. It relies on the fact that success in intraday trading requires you to enter and exit trades with the backing of major support or resistance; the positioning of this resistance being determined by the equation. To use the Camarilla Equation, you enter yesterday's open, high, low and close. The calculation then gives you 8 levels of intraday support and resistance. There are 4 of these levels above yesterday's close, and 4 below as shown below.
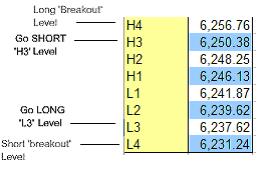
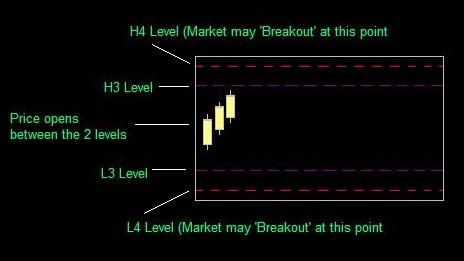
As you can see, trading with the Camarilla Equation is relatively simple. The important levels to note are the 'L3' and 'H3' levels, where you may expect a reversal to occur, and the 'L4' and 'H4' levels that shows you where a major breakout has been confirmed. How you specifically enter a trade depends to a great extent on the way the market opens.
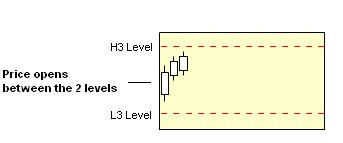
Market Opens INSIDE 'L3'
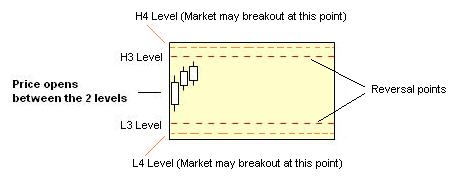
The following applies both to going 'Long' and going 'short'. If the market opens INSIDE the L3 and H3 levels (i.e. BETWEEN the higher H3 and the Lower L3), you must wait for price to approach either of these two levels. Whichever it hits first (L3 or H3) determines your trade.
If the HIGHER H3 level is hit, you go SHORT (against the trend) in the expectation that the market is about to reverse. Some traders recommended using the higher 'H4' level as your stoploss point, as a penetration up thru the H4 level actually shows that a major breakout may be under way. I would recommend that you wait for price to bounce back down inside the H3 level again before entering the trade, as you will therefore be technically trading WITH the short-term trend. A fair amount of experience is needed for this style of trading.The opposite, of course applies if the LOWER L3 level is hit first - wait for it to come back up inside the lower L3 level, then go LONG.
Market Opens Outside 'L3'
In this case, you wait for the market to move back up thru the L3 level - you will then be trading WITH the trend, and once again, some traders recommended using the L4 level as your stop loss (although perhaps you should use a sensible stop based on your knowledge of your market.)
Taking profits is a matter of personal judgement - just be aware that you WILL want to take profits at some time during the day, because the market is unlikely to 'behave' and stay right-sided for your trade.
Research suggests that these reversals from L3 and H3 happen as often as 4 times out of 5 during intraday trading.
Using the Equation to trade 'breakouts' is also eminently possible, and essentially involves you going LONG if price penetrates UP thru the higher H4 level, or going SHORT if price penetrates DOWN thru the lower L4 level.
Ok so now you know a little about the equation and how to use it, here is what you have all been waiting for so patiently..... The Equation.
H4 = [1.1*(H-L)/2]+C
H3 = [1.1*(H-L)/4]+C
H2 = [1.1*(H-L)/6]+C
H1 = [1.1*(H-L)/12]+C
L1 = C-[1.1*(H-L)/12]
L2 = C-[1.1*(H-L)/6]
L3 = C-[1.1*(H-L)/4]
L4 = C-[1.1*(H-L)/2]
Where:
H = Days high
L = Days low
C = Days Close
(All values are for the previous day prior to the trade day)
I hope this is of some help, good luck and Happy Trading
Note: I do not accept liability for the accuracy of the equation nor any unexpected results if used for trading.